
South Africa Become New No.1 in Tests, Australia Slip Two Places; New Zealand Still Ahead in WTC
दक्षिण अफ्रीका ने ऑस्ट्रेलिया को घरेलू सीरीज़ 2-1 से हराकर आईसीसी टेस्ट रैंकिंग में नंबर-1 हासिल किया — दक्षिण अफ्रीका 124 अंक, ऑस्ट्रेलिया 122 अंक (तीसरा स्थान, दो पायदान की गिरावट)। WTC 2025-27 प्रतिशत तालिका: न्यूज़ीलैंड 72.22%, दक्षिण अफ्रीका 71.43%, ऑस्ट्रेलिया 69.23% (पहले 80.00%)। दक्षिण अफ्रीका का प्रतिशत सीरीज़ जीतने पर भी 75.00 से 71.43 गिरा, क्योंकि हर मैच भाजक में जुड़ता है (5 जीत/2 हार = 60/84)। ऑस्ट्रेलिया: सीरीज़ से पहले 8 जीत/10 मैच = 96/120; बाद में 9 जीत/4 हार/13 = 108/156। निर्णायक टेस्ट केप टाउन के न्यूलैंड्स में 176 रन से जीता गया; टेम्बा बवुमा ने ग्केबेर्हा में 179 रन बनाए। भारत के पास चक्र में सात टेस्ट शेष — 2 न्यूज़ीलैंड (इसी महीने) और 5 ऑस्ट्रेलिया (अगले साल शुरुआत); सातों जीतना फाइनल की गारंटी है लेकिन एकमात्र रास्ता नहीं। सभी रैंकिंग आँकड़े हर मैच के बाद बदलते हैं और इस रिपोर्ट में स्नैपशॉट तारीख़ दर्ज नहीं है।
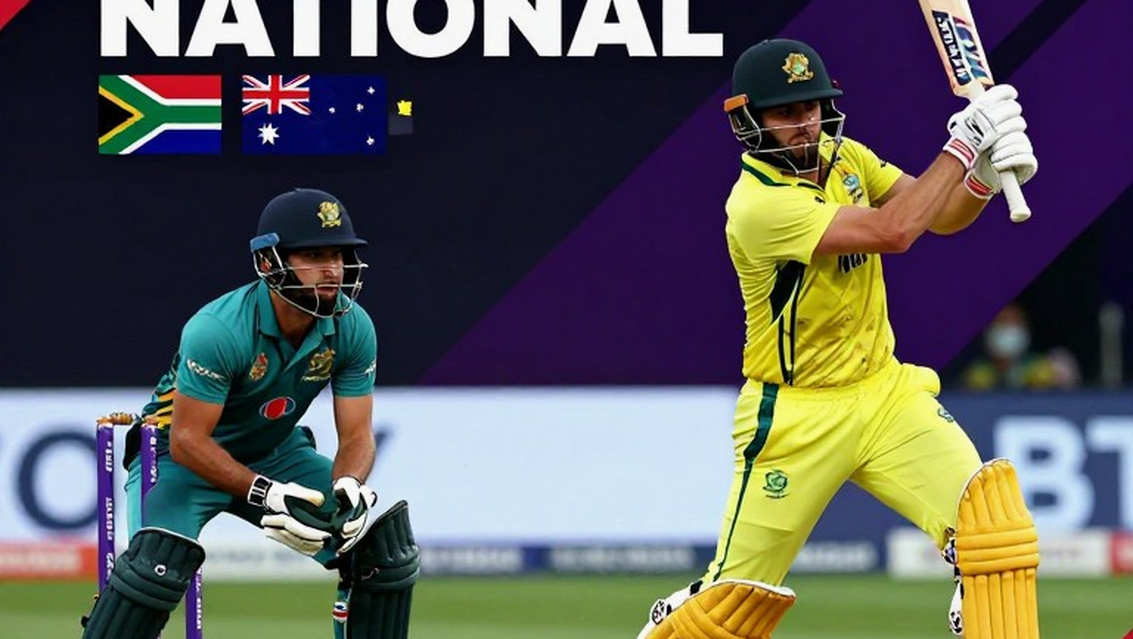
South Africa have claimed the No.1 spot in the ICC Test rankings by beating Australia 2-1 at home. The decisive Test at Newlands, Cape Town was won by 176 runs, and having lost the opener, South Africa came back from 1-0 down to take the series 2-1. In the latest ICC Test rankings, South Africa have 124 points and Australia 122 — a gap of just two points, which itself shows how fragile the crown is.
The win lifted South Africa in two tables at once, but the experience in each was different. In the ICC rankings it went straight to the top. In the points-percentage table of the current 2026-27 World Test Championship (WTC) cycle it sits second at 71.43 per cent, behind New Zealand (72.22 per cent) and ahead of Australia (69.23 per cent). That means Australia slipped two places from the top in both tables and South Africa climbed in both — but the WTC top spot did not come to it.
Two tables, two different outcomes
The contradiction looks bigger than it is, and it needs explaining, because this is the least understood part of WTC arithmetic. Before the series South Africa's WTC percentage was 75.00: four matches, three wins, one loss — 36 points out of 48 available. Despite winning the series 2-1, their percentage fell to 71.43, because the WTC percentage is total points divided by matches played, and every extra match adds to the denominator. Three more matches made the record 5 wins and 2 losses — 60 divided by 84, or 71.43 per cent. In other words, South Africa did not rise by winning the series; they were already on top, and one defeat pushed them behind New Zealand. It is a common misconception that the side winning a series always gains WTC percentage. It does not.
The difference between the two tables should also be made clear, because it is the biggest source of reader error. The ICC Test ranking is a rolling, weighted system in which results from several past years carry different weights; it moves slightly after every match and old performances do not vanish at once. The WTC percentage is the opposite — only current-cycle points, divided by the cycle's total available points. So the same team can sit at different positions in the two. New Zealand are the freshest example: third in the ICC rankings, first in the WTC. New Zealand, India and England are also said to be in the top five, but the available table gives no points for them — so the top-five picture remains incomplete.
The series story: Bavuma's 179 and Cape Town's 176
The centre of the series is captain Temba Bavuma's innings. Having lost the first Test, the second at Gqeberha (Port Elizabeth) became decisive for South Africa, and there Bavuma's 179 brought the side back into the contest. On the back of that innings South Africa levelled the series, then won at Cape Town by a big 176-run margin to take both the series and the No.1 ranking. Bavuma afterwards called it the biggest series win of his Test career and said the No.1 ranking was the product of the work this group has put in over the last two years.

One piece of history belongs here too: South Africa came into this having won the WTC final last year, and that final was also against Australia. So this is the side that already holds the trophy and is now also the top-ranked Test team — both achievements earned against the same opponent. That raises the significance of this series further.
Australia's double loss
For Australia the series cost them on two fronts. Their WTC percentage fell from 80.00 to 69.23: before the series they topped the table with 8 wins in 10 matches (96/120); after three more they stand at 9 wins and 4 losses in 13 (108/156). In the ICC rankings too they slid from the top to second and then third. Worth noting: this report carries no analysis of Australia's defeat — no captain's reaction, no selector comment, no technical explanation of the batting collapse. Publicly the series is being viewed mainly through the lens of South Africa's comeback, which is itself a framing choice — the bigger story is not Australia falling, but South Africa reaching the summit.
One more point usually ignored: South Africa's 71.43 per cent rests on only seven Tests, against Australia's 13 and New Zealand's 12 to 18. Percentage-of-points normalises the denominator but not the sampling variance. A seven-match percentage can swing very fast on a single result — so that gap should be kept in mind when answering 'who is really No.1'. That is also why the two-point gap between 124 and 122 should not be treated as solid; in a rolling rating one series can flip the crown.
The India equation: seven Tests, and one correction
India's angle needs explaining separately. India have seven Tests left in the current cycle — two against New Zealand this month and five against Australia early next year. Winning all seven would guarantee a place in the final, but saying that is the 'only way' is not correct on the numbers. Draws also earn WTC points, and if rivals drop points a clean sweep stops being a necessary condition. Winning all seven is a safe route, not the only one.
Equally, saying South Africa's win 'changed nothing for India' is shallow. It is true that India's own points and percentage are untouched. But Australia — a direct rival for a final spot — have dropped two WTC places, which is plainly favourable to India's relative position. Rather than 'nothing changed', the accurate statement is that India's own arithmetic has not changed, but the contest has become easier.
What to watch next
For South Africa the next challenge is proving the summit is not a seven-match coincidence — they have enough matches ahead in the next cycle, and every result will move the percentage fast. For Australia the question is whether this two-place slide is series noise or the start of something bigger; their chance to respond comes in the next series against India. And for India, the two-Test series against New Zealand starting this month will decide whether their 'seven out of seven' calculation becomes a necessity.
A transparency note that rankings-based reporting of this kind needs: every percentage here comes from public ICC and WTC tables, which change after every match and which this report does not date. They should be re-checked with a date before any further citation. Likewise, the series result, the 176-run margin and Bavuma's 179 are all facts verifiable independently against a scorecard, and should be checked that way rather than on the strength of a single report.